




We turn voyage data into fuel and cost savings
Oceata combines AIS, satellite weather and vessel performance data to reduce fuel consumption, optimise routing, improve charterparty performance and automate emissions reporting.
The platform
Turning ocean data into commercial advantage
Oceata builds a unique performance fingerprint for every vessel in your fleet using AIS, weather and operational data. From that single source comes performance analysis, voyage optimisation and emissions reporting powered by machine learning and validated by experienced maritime experts.
Access real-time and historical ocean intelligence through intuitive dashboards or integrate Oceata seamlessly with the navigation, reporting and fleet management systems you already use.
Historical Voyage Analysis(HVA)
- Type
- Cargo · General Cargo Ship
- Name
- M.V. NAUTILUS
- Dimensions
- 124 m × 17 m
- Fuel grades
- LFO · MDO
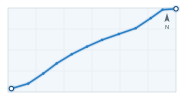
AIS track · point by point · no coordinates
- AIS track pulled automatically
- Satellite weather current · swell · wind
- Noon reports 25 · daily
- 6,006 nm
- Distance run
- 25 days
- Steaming time
- 10.01 kn
- Avg SOG
- 532.70 mt
- Fuel consumed
Add a voyage and HVA builds a unique performance fingerprint for every vessel, analysing good-weather performance across all fuel types and charter-party forms while automatically accounting time, fuel, off-hire, deviations, bunkering and other exclusion periods. It's the foundation every Oceata insight is built upon.
Performance, fuel & compliance
Good-weather speed vs charter party
Warranted 12.5 kn (charter party)
1.03 days behind C/P time · 24.65 h
Performance Analytics
Speed and consumption, route efficiency and fuel use, benchmarked against the charter-party terms — isolate good-weather performance and see exactly where a voyage gained time or lost it.
Daily fuel vs charter-party allowance
Allowance 21.53 mt/day (+5% margin)
52.49 mt over allowance · read with emission factors
Fuel Consumption Monitoring
Track fuel use across the fleet for cost control and compliance, with real-time alerts and detailed reports. Every fuel type carries its emission factors, so consumption and emissions are read from the same numbers.
Those factors feed SEEMP and the other emission regulations.
Schemes monitored · one dataset
- SEEMP
- EU ETS THETIS
- CII
- EEOI
- EEXI
- EEDI
Environmental Compliance
Compliance falls out of the same voyage data you already analyse, not a separate exercise — every scheme your fleet answers to, with EU ETS output in THETIS format.
HVA is the engine: the same voyage history powers OVR's routing and the Performance Desk's post-voyage analysis.
Flagship · Machine learning
Optimum Voyage Routing (OVR)
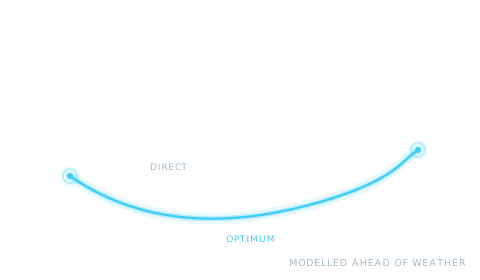
OVR is where the historical data points forward. It pairs real-time metocean data with your HVA history to model how each vessel actually performs in different seaways, then recommends the route that holds your schedule for the least fuel and cost — working ahead of the weather rather than reacting to it.
Every recommendation is decision support for your team, not an instruction that overrides the bridge.
uses HVA history
Technical coverage
- Historical Voyage Analysis (HVA)
- NYPE · BOXTIME · ShellLNGtime 2
- Performance Analytics
- Speed & consumption · C/P benchmarking
- Fuel Consumption Monitoring
- Emission factors · Real-time alerts
- Environmental Compliance
- CO2 · NOx · SOx · PM · CH4
- Optimum Voyage Routing (OVR)
- Real-time metocean · HVA history · Decision support
Any vessel, any ocean.
Real proof
A real voyage, analysed end to end
A real, anonymised voyage: the headline figures, the analytics behind them, and the kind of insight you get back — real numbers, checked by a Master Mariner.
Fuel vs charter-party
+52.49 mt over allowance
Fuel burned over the charter-party allowance on the matched good-weather time — the exact figure a performance claim is built on.
6,006 nm over 25 days, plotted point by point
How these figures are calculated
- Distance run
- Total distance over the ground for the voyage, summed leg by leg along the AIS track.
- Steaming time
- Elapsed time on passage from departure to arrival.
- Fuel consumed
- Total fuel burned over the voyage, in metric tonnes, from the noon-report and consumption record.
- Fuel vs charter-party
- Good-weather fuel used against the charter-party allowance (with its agreed margin) over the matched good-weather time.
- CO2 emitted
- The voyage's total fuel for emissions (538.125 mt) converted with the standard IMO CO2 factor for the fuel grade — 3.114 tonnes of CO2 per tonne of fuel.
- Voyage in beneficial weather
- Share of voyage time spent in beneficial rather than adverse conditions, assessed separately for current, swell and wind.
Platform activity
Across your fleet
Aggregate activity across the platform: voyages routing, voyages analysed, and the fuel, time and emissions those optimisations are working to save.
Periodic feed · as of —
Sample figures, shown for illustration.

The desk
Machine precision, mariner judgement
The models do the computation; our experts sign off the conclusion.
Every Oceata report is personally assessed by industry experts before it is released.
Our aim is to be the world's leading provider of ocean data services — making maritime decisions safer, more efficient and more sustainable, on data the industry can trust.
Performance Desk
An independent, post-fixture consultancy that reads the voyage data and tells you what actually happened. Fact-based assessments that settle disputes rather than start them.
Validate whether the vessel performed as per its charter-party terms, ensuring accurate claims and cost control.
Determine how hull and propeller condition affects fuel consumption and efficiency.
Identify unnecessary detours, suboptimal routing and inefficiencies that increase costs.
Evaluate how severe weather affects performance, cargo and overall voyage safety.
Assess damage caused by rough seas, vessel motions or operational decisions.
Oceata's bespoke LNG calculator assessing Boil-Off-Gas, fuel consumption, timeliness, fixed and floating oil equivalent, composition, CTMS and flow meter measurement.
How every report is signed off
-
The platform builds the voyage's performance fingerprint from its AIS, satellite-weather and noon-report data.
-
Every report is personally assessed by industry experts — a hands-on review, not an automated read-out.
-
Assured for quality before it is released, so what reaches you is accurate and actionable.
The data, the curves and the calculation are all on the table, so you can see why the report reached its conclusion.
Beyond the platform
- Custom data solutions
Bespoke data work and integration with the maritime systems you already run.
Emissions and compliance
We measure, monitor and report the schemes your fleet is measured against.
- SEEMP
- EU ETS
- CII
- EEOI
- EEXI
- EEDI
- Supporting member, LMAA
- Trusted by P&I Clubs
- Trusted by maritime law firms
The team
Expertise on the bridge and in the code

Nathan Mills
Founder & Master Mariner
Deep-sea Master Mariner, 30+ years at sea from Cadet to Captain — Royal Fleet Auxiliary, BP, P&O, Stena, Crystal Cruises. Founder of Nathan Mills Marine, serving major P&I Clubs and maritime law firms; LMAA supporting member.

Derren Nugent
Head of Group IT
Leads Group IT and Oceata’s core systems, including the Historical Voyage Analysis (HVA) platform — turning complex voyage and performance data into clear, actionable analysis.

Dylan Williams
Head of Machine Learning
MSc in Artificial Intelligence (Southampton). Leads Oceata's machine-learning team and the continuous development of OVR (Optimum Voyage Routing).
Team Oceata - Experienced, Dedicated, Dynamic and Capable.
Request a demo
Let's talk
Ready to see Oceata on your own voyages? Request a demo and we'll show you the platform on real data.
Pricing is tailored to your fleet and the services you need; tell us a little and we'll come back with the detail.
MHA 11 Merus Court, Meridian Business Park, Leicester, United Kingdom, LE19 1RJ